The approach followed in Netgen/Pickcell set of tools is to represent physical evolution facts using a cellular model. Cells can be of arbitrary size. They contain their geographic coordinate, and thus, can be completed with values coming from data sets or data bases. Elevation information is an example of these added data obtained from NASA SRTM files, or from public server.
Using these information, many physical behaviors can be simulated. This page shows images and movies resulting of such computations. Two examples are radio coverage computed in a 3D environment, and rain dispersion in a complex city.
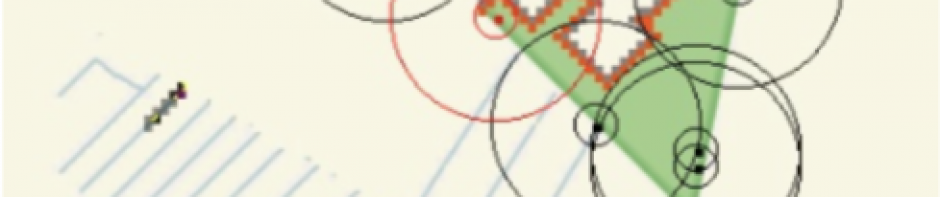
By combining a serie of coverage combination along a path, zones reached by a mobile moving over the sea. At each move the land covered by the radio signal is displayed. Computations are achieved on an Nvidia Geforce accelerator, data organization is automatically produced from Netgen/Pickcell environment.
Radio signal propagation
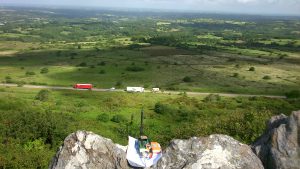
These 2 pictures display a fixed location in a high place (Roch’ Trevezel, Brittany). On the first picture, we see a Lora emitter (Recoco board). On second picture, a car was driven to check a zone for the presence of a received signal predicted by a LoRa propagation simulation (pink cells). Circles display agreements.
Mobile and Lora signal visibility
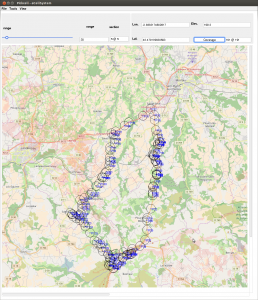
This movie shows a mobile traveling over bay of Brest, from the right to the left. A Lora radio is supposed to be fixed in the mobile travelling at a 40m altitude. The video shows a simulation of radio coverage obtained from the boat (Nvidia gtx 1070, Ubuntu i7 PC). Each step is executed in few ms. The second picture displays a smooth move along the path, with an high resolution.
OGV short Video (click on) displaying the visit of a boat (red spot + cursor) that illuminate bay of Brest coast during its trip.
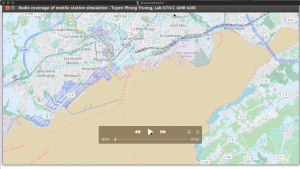
Mobile altitude 40M, smooth moves. MP4 file
Rain simulation
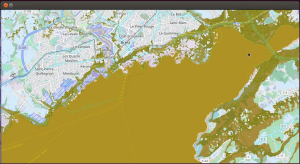
In this demonstration a map has been broken into 150000 squared cells of 5 meters, smaller of elevation resolution. The simulation has an array of rain height falling uniformly on the city. The transition function consists of getting water from upper neighbor cells, throwing a part of the local water, and sharing the more important part with neighbors of lower elevation.The blue color intensity represents the flooding expected in each cell. Most of the water will be absorbed by the sea, or the river inside the city. Simulation reveals valleys that could be equipped by sensor detecting abnormal level of water.
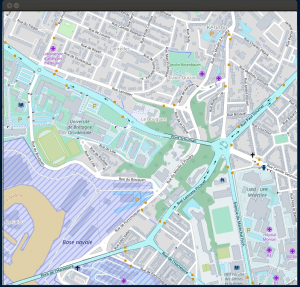
MP4 Video displaying water circulation simulation during the passage of an heavy rain Penfeld river is at the bottom, Kerinou valley conveys water to Penfeld. Flooding of up to 1 meter are common at the bottom.. The software can also compute best position for sensors from prediction f flooding. See public location of map at https://www.google.fr/maps/@48.3928424,-4.4952448,14z/data=!5m1!1e4. The displayed background comes from Open Street Map view inside QuickMap browser.
Brest rain simulation times on some GPUs
